数字图像处理 第 5 周作业 
about 743 words 221 lines of code 4 images reading time 6 minutes
1. 均衡化 
处理思路:
- 读取灰度图片
image之后,首先遍历每一个像素,统计每个灰度值出现的次数,得到原图像的统计直方图hist。 - 统计直方图归一化,除以总像素个数,得到像素值的概率密度函数
pdf。 - 将概率密度函数累加得到累积分布函数
cdf,乘以最大灰度级 255,得到原灰度值映射到的新灰度值关系pixel_new。 - 根据
pixel_new生成均衡化后的图像image_equalized,并遍历像素得到统计直方图。
源代码文件见 ./task1/main.py,运行结果如下:
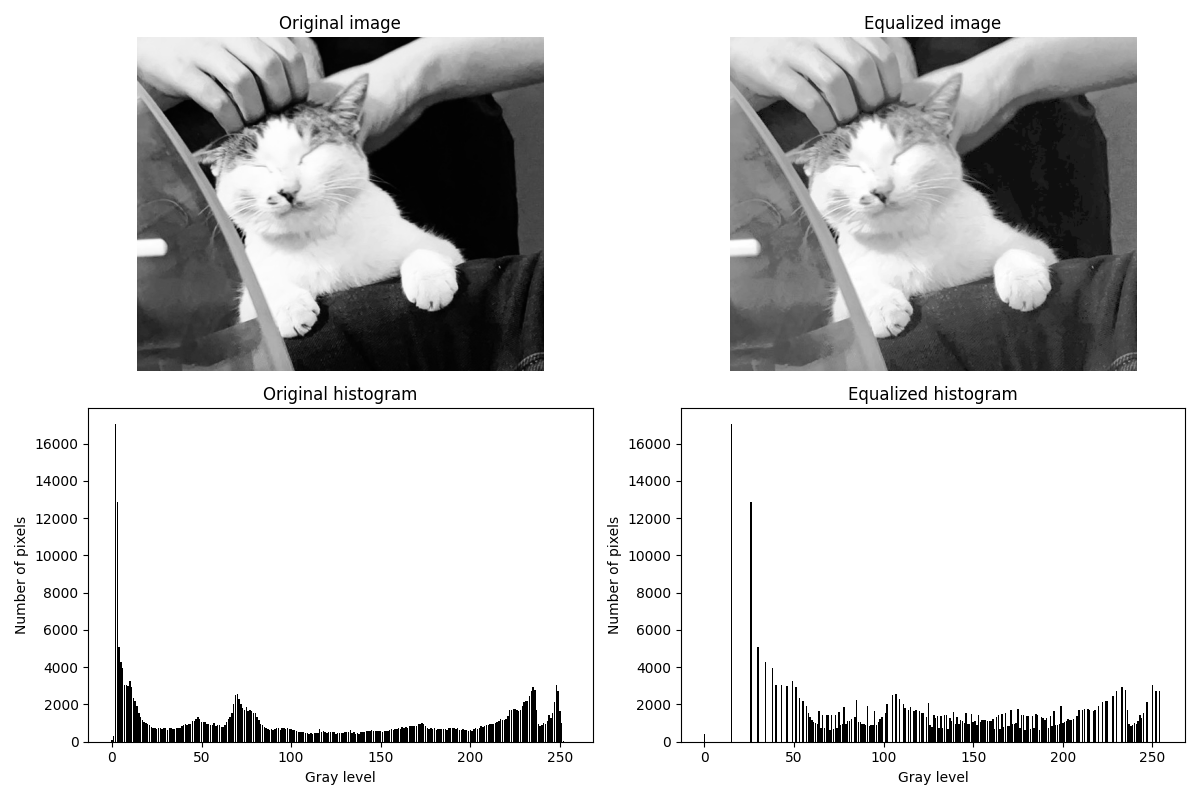
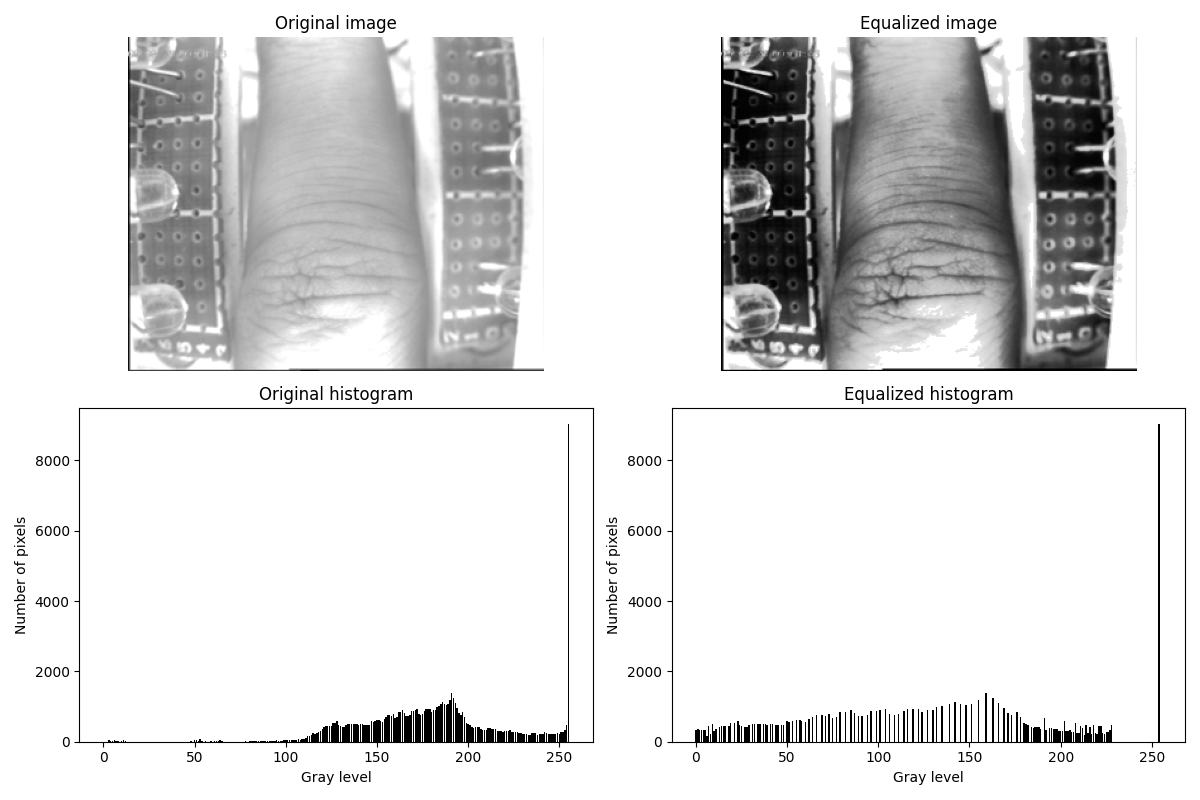
可见,处理过后图片的对比度明显增强,像素的灰度值动态范围扩大至几乎占满 \([0,255]\) 区间。图片 1 中人物裤子亮度明显增加,这周更加明显。图片 2 中两侧面包板变暗,与手指的对比更加明显。
2. 规定化 
处理思路:由于输入为彩色图片,需要对 RGB 三个通道分别进行规定化,共用一个函数 channel_specification()。
在 channel_specification() 函数中,首先调用 compute_cdf() 函数,其中计算 cdf 的方法与 task1 均衡化相同。得到原图像和模板图像的直方图累积分布函数,然后建立两个累积分布函数的映射关系 mappping:对于原图像 cdf 中的每一个值,找到在模板图像 cdf 中与它最接近的值,其对应的灰度级就是规定化之后的灰度级,再根据 mapping 逐像素构建规定化之后的图像。
在 histogram_specification 中,将原图像和模板图像拆分为 R,G,B 三个通道,对每个通道进行规定化处理,再拼接起来得到规定化之后的图像。
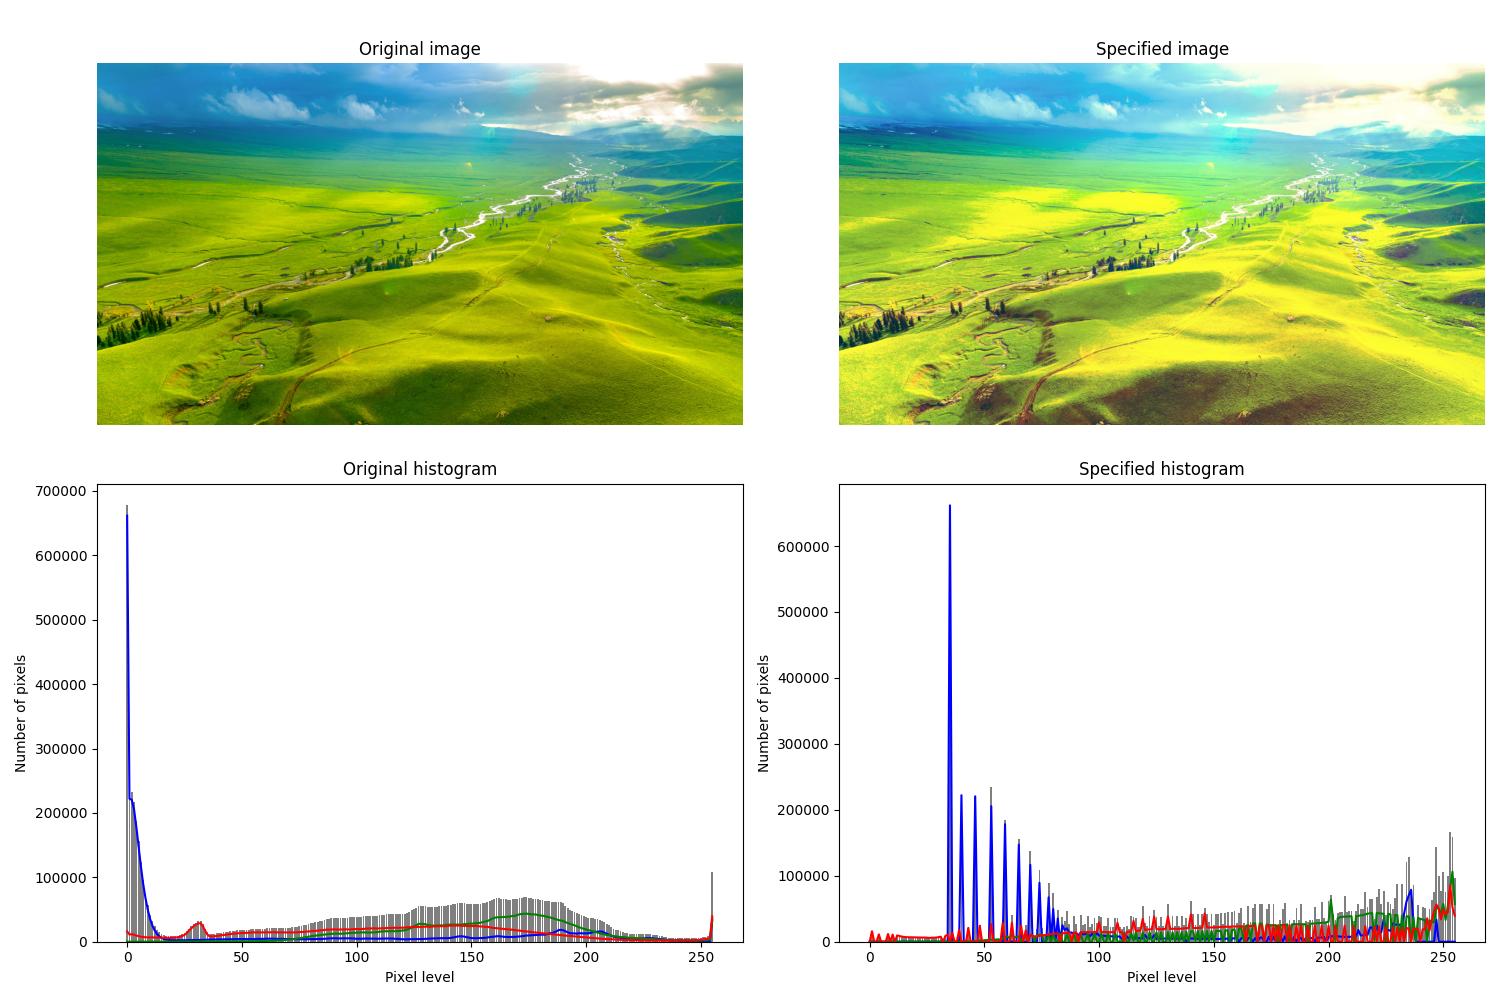
源代码文件见 ./task2/main.py,运行结果如下:
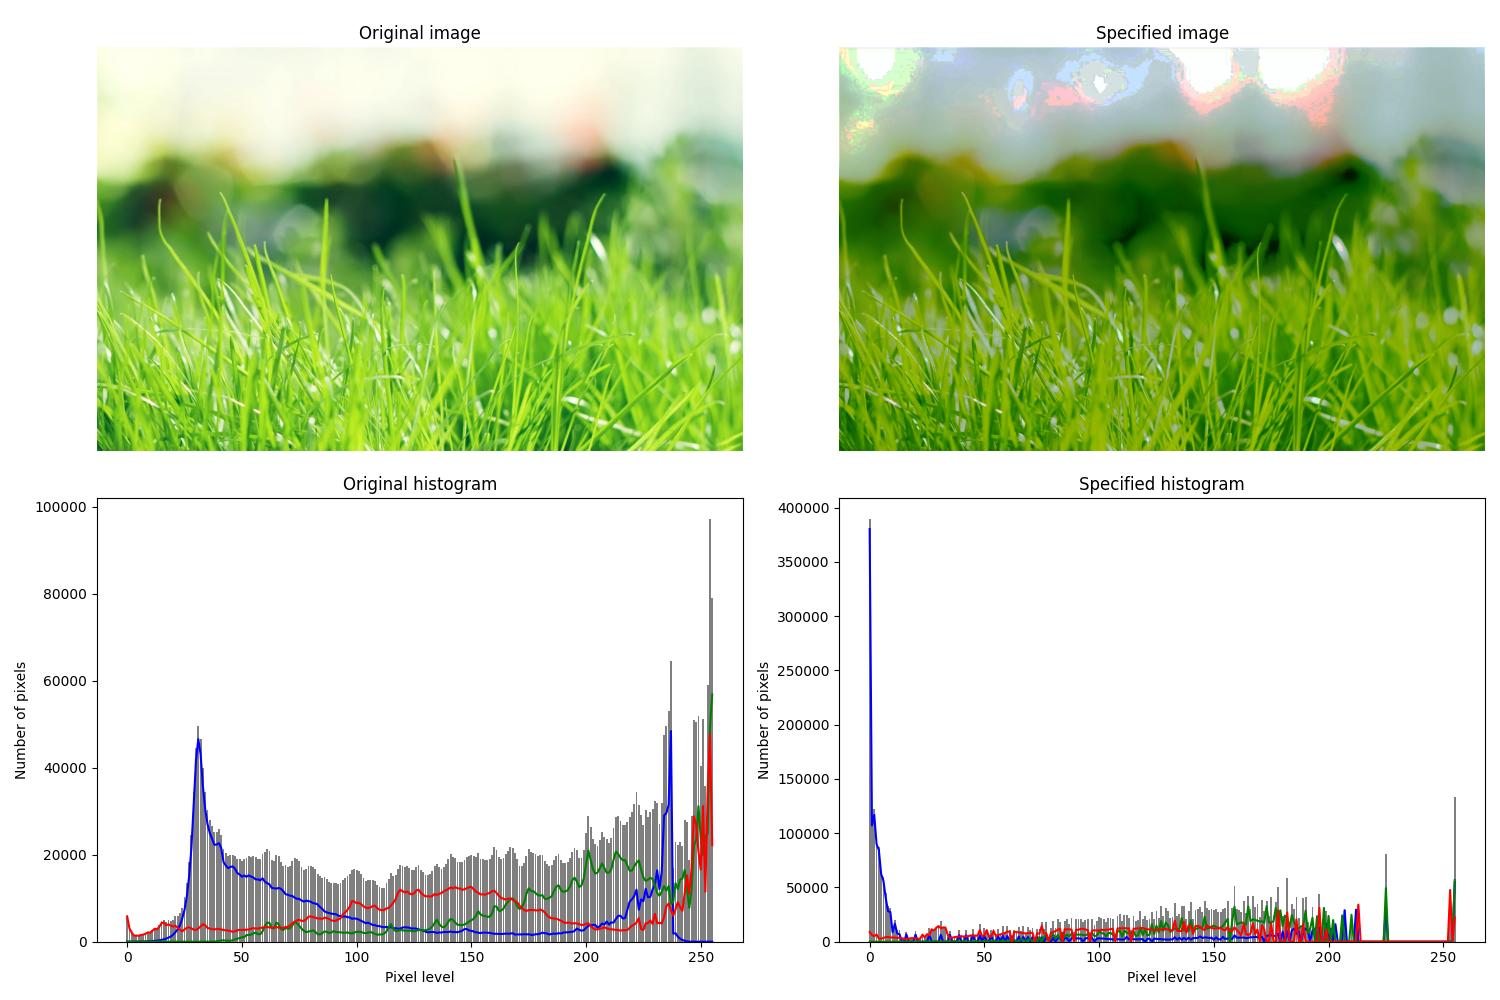
对于图片 1,处理过后图片整体变得更加暗淡,不如原图像那么明亮鲜艳,主要原因是绿色通道像素值原本集中在高值部分,显得整体明亮,经过规定化之后分布更加均匀,低值部分像素数目增多,高值部分像素减少。蓝色通道像素值更加集中在低值部分,因为作为模板的图片 2 蓝色通道像素值也集中在低值部分。
对于图片 2,处理过后,草原的对比度明显增加,部分绿色区域经过处理之后变得更偏近黄色,可能是因为虽然蓝色通道整体强度略有提升,但是作为模板的图片 1 中红色和绿色通道的像素值更集中在高值部分,规定化之后的图片 2 红色和绿色通道强度提升更多,因此从视觉上黄色区域增多。
3. 源代码 
均衡化 task1.py :
import cv2
import matplotlib.pyplot as plt
import numpy as np


def histogram_equalization(image_path):
    """对图像进行直方图均衡化

    Args:
        image_path (str): 输入图像的路径
    """
    image = cv2.imread(image_path, cv2.IMREAD_GRAYSCALE)
    height, width = image.shape

    # 统计直方图
    hist = np.zeros(256, dtype=int)
    for i in range(height):
        for j in range(width):
            hist[image[i, j]] += 1

    # 归一化得到概率密度函数 PDF
    pdf = hist / (height * width)

    # 计算累积分布函数 CDF
    cdf = np.zeros(256, dtype=float)
    cdf[0] = pdf[0]
    for i in range(1, 256):
        cdf[i] = cdf[i - 1] + pdf[i]

    # 映射回[0,255]
    pixel_new = (cdf * 255).astype("uint8")

    # 生成均衡化图像
    image_equalized = np.zeros_like(image)
    image_equalized = pixel_new[image]

    # 计算均衡化后的直方图
    hist_equalized = np.zeros(256, dtype=int)
    for i in range(height):
        for j in range(width):
            hist_equalized[image_equalized[i, j]] += 1

    new_path = image_path.rsplit(".", 1)[0] + "_new.png"
    cv2.imwrite(new_path, image_equalized)
    print(f"save the image after histogram equalization to: {new_path}")

    plt.figure(figsize=(12, 8))

    plt.subplot(2, 2, 1)
    plt.imshow(image, cmap="gray")
    plt.title("Original image")
    plt.axis("off")

    plt.subplot(2, 2, 2)
    plt.imshow(image_equalized, cmap="gray")
    plt.title("Equalized image")
    plt.axis("off")

    plt.subplot(2, 2, 3)
    plt.bar(range(256), hist, color="black")
    plt.title("Original histogram")
    plt.xlabel("Gray level")
    plt.ylabel("Number of pixels")

    plt.subplot(2, 2, 4)
    plt.bar(range(256), hist_equalized, color="black")
    plt.title("Equalized histogram")
    plt.xlabel("Gray level")
    plt.ylabel("Number of pixels")

    plt.tight_layout()

    compare_path = image_path.rsplit(".", 1)[0] + "_compare.png"
    plt.savefig(compare_path)
    print(f"save the comparison of original and equalized image to: {compare_path}")

    plt.show()


def main():
    histogram_equalization("./img1.png")
    histogram_equalization("./img2.png")


if __name__ == "__main__":
    main()
规定化 task2.py :
import cv2
import matplotlib.pyplot as plt
import numpy as np


def compute_cdf(channel):
    """计算单通道的累积分布函数

    Args:
        channel (np.ndarray): 单通道图像

    Returns:
        np.ndarray: 累积分布函数
    """
    hist = np.zeros(256, dtype=int)
    height, width = channel.shape
    for i in range(height):
        for j in range(width):
            hist[channel[i, j]] += 1

    pdf = hist / (height * width)

    cdf = np.zeros(256, dtype=float)
    cdf[0] = pdf[0]
    for i in range(1, 256):
        cdf[i] = cdf[i - 1] + pdf[i]

    return cdf


def channel_specification(image, template):
    """对单个通道进行规定化

    Args:
        image (np.ndarray): 原图像通道
        template (np.ndarray): 模板图像通道

    Returns:
        np.ndarray: 规定化后的通道
    """
    cdf_image = compute_cdf(image)
    cdf_template = compute_cdf(template)

    mapping = np.zeros(256, dtype=int)
    for i in range(256):
        min_diff = float("inf")
        argmin_j = 0
        for j in range(256):
            diff = abs(cdf_image[i] - cdf_template[j])
            if diff < min_diff:
                min_diff = diff
                argmin_j = j
        mapping[i] = argmin_j

    new_channel = np.zeros_like(image)
    new_channel = mapping[image].astype(np.uint8)

    return new_channel


def histogram_specification(image_path, template_path):
    """根据模板图像对目标图像进行直方图规定化

    Args:
        image_path (str): 原图像路径
        template_path (str): 模板图像路径
    """
    image = cv2.imread(image_path)
    template = cv2.imread(template_path)

    image_b, image_g, image_r = cv2.split(image)
    template_b, template_g, template_r = cv2.split(template)

    new_b = channel_specification(image_b, template_b)
    new_g = channel_specification(image_g, template_g)
    new_r = channel_specification(image_r, template_r)

    new_image = cv2.merge([new_b, new_g, new_r])
    new_path = image_path.rsplit(".", 1)[0] + "_new.jpg"
    cv2.imwrite(new_path, new_image)
    print(f"save the image after histogram specification to: {new_path}")

    plt.figure(figsize=(15, 10))

    plt.subplot(2, 2, 1)
    plt.imshow(cv2.cvtColor(image, cv2.COLOR_BGR2RGB))
    plt.title("Original image")
    plt.axis("off")

    plt.subplot(2, 2, 2)
    plt.imshow(cv2.cvtColor(new_image, cv2.COLOR_BGR2RGB))
    plt.title("Specified image")
    plt.axis("off")

    plt.subplot(2, 2, 3)
    total_hist = np.zeros(256)
    for channel, color in enumerate(["b", "g", "r"]):
        hist = cv2.calcHist([image], [channel], None, [256], [0, 256])
        plt.plot(hist, color=color)
        total_hist += hist.flatten()
    plt.bar(range(256), total_hist, color="k", alpha=0.5)
    plt.title("Original histogram")
    plt.xlabel("Pixel level")
    plt.ylabel("Number of pixels")

    plt.subplot(2, 2, 4)
    total_hist = np.zeros(256)

    for channel, color in enumerate(["b", "g", "r"]):
        hist = cv2.calcHist([new_image], [channel], None, [256], [0, 256])
        plt.plot(hist, color=color)
        total_hist += hist.flatten()
    plt.bar(range(256), total_hist, color="k", alpha=0.5)
    plt.title("Specified histogram")
    plt.xlabel("Pixel level")
    plt.ylabel("Number of pixels")

    plt.tight_layout()

    compare_path = image_path.rsplit(".", 1)[0] + "_compare.jpg"
    plt.savefig(compare_path)
    print(f"save the comparison of original and specified image to: {compare_path}")

    plt.show()


def main():
    histogram_specification("./img1.jpg", "./img2.jpg")
    histogram_specification("./img2.jpg", "./img1.jpg")


if __name__ == "__main__":
    main()